
Pipelines Don’t Go Down Cleanly — They Fall Behind
Your pipeline deployed cleanly. Six hours into real production traffic, someone notices a gaping hole in their dashboards, three hours of logs are silently missing. There are no errors. There are no alerts. The pipeline simply fell behind under load and quietly dropped what it couldn't catch up on.
That is the exact failure mode that makes telemetry pipelines different. It is rarely a clean, loud outage. Instead, it is a slow bleed that only surfaces when someone goes looking, usually at the worst possible time during an active incident.
Note: The foundational architecture from Post 1 and the fault isolation principles from Post 2 still apply. Everything discussed here handles the unique mechanics of continuous data ingestion.
Use example of Telemetry Pipeline
Think of a telemetry pipeline as the exact opposite of a traditional web service. A web service waits for an inbound request to ask it something. A pipeline never stops, instead it moves data continuously from where it's produced to where it's useful, whether anyone is watching or not.
The Streaming Topology
The data flow moves continuously across decoupled boundaries:
Producers          Telemetry Pipeline           Sinks
───────────────────────────────────────
Services─┐                              ┌─►Datadog(Metrics)
Agents  ─┼►[Ingest]─►[Buffer/Process]┼─►Datadog(APM)
Infra   ─┘                              └─► ClickHouse(Logs)
Continuous inbound flow. N processing stages. N outbound sinks.
There is no request boundary, and no natural unit of success or failure. Data flows, or it doesn't, and without the right signals, you will find out far too late.
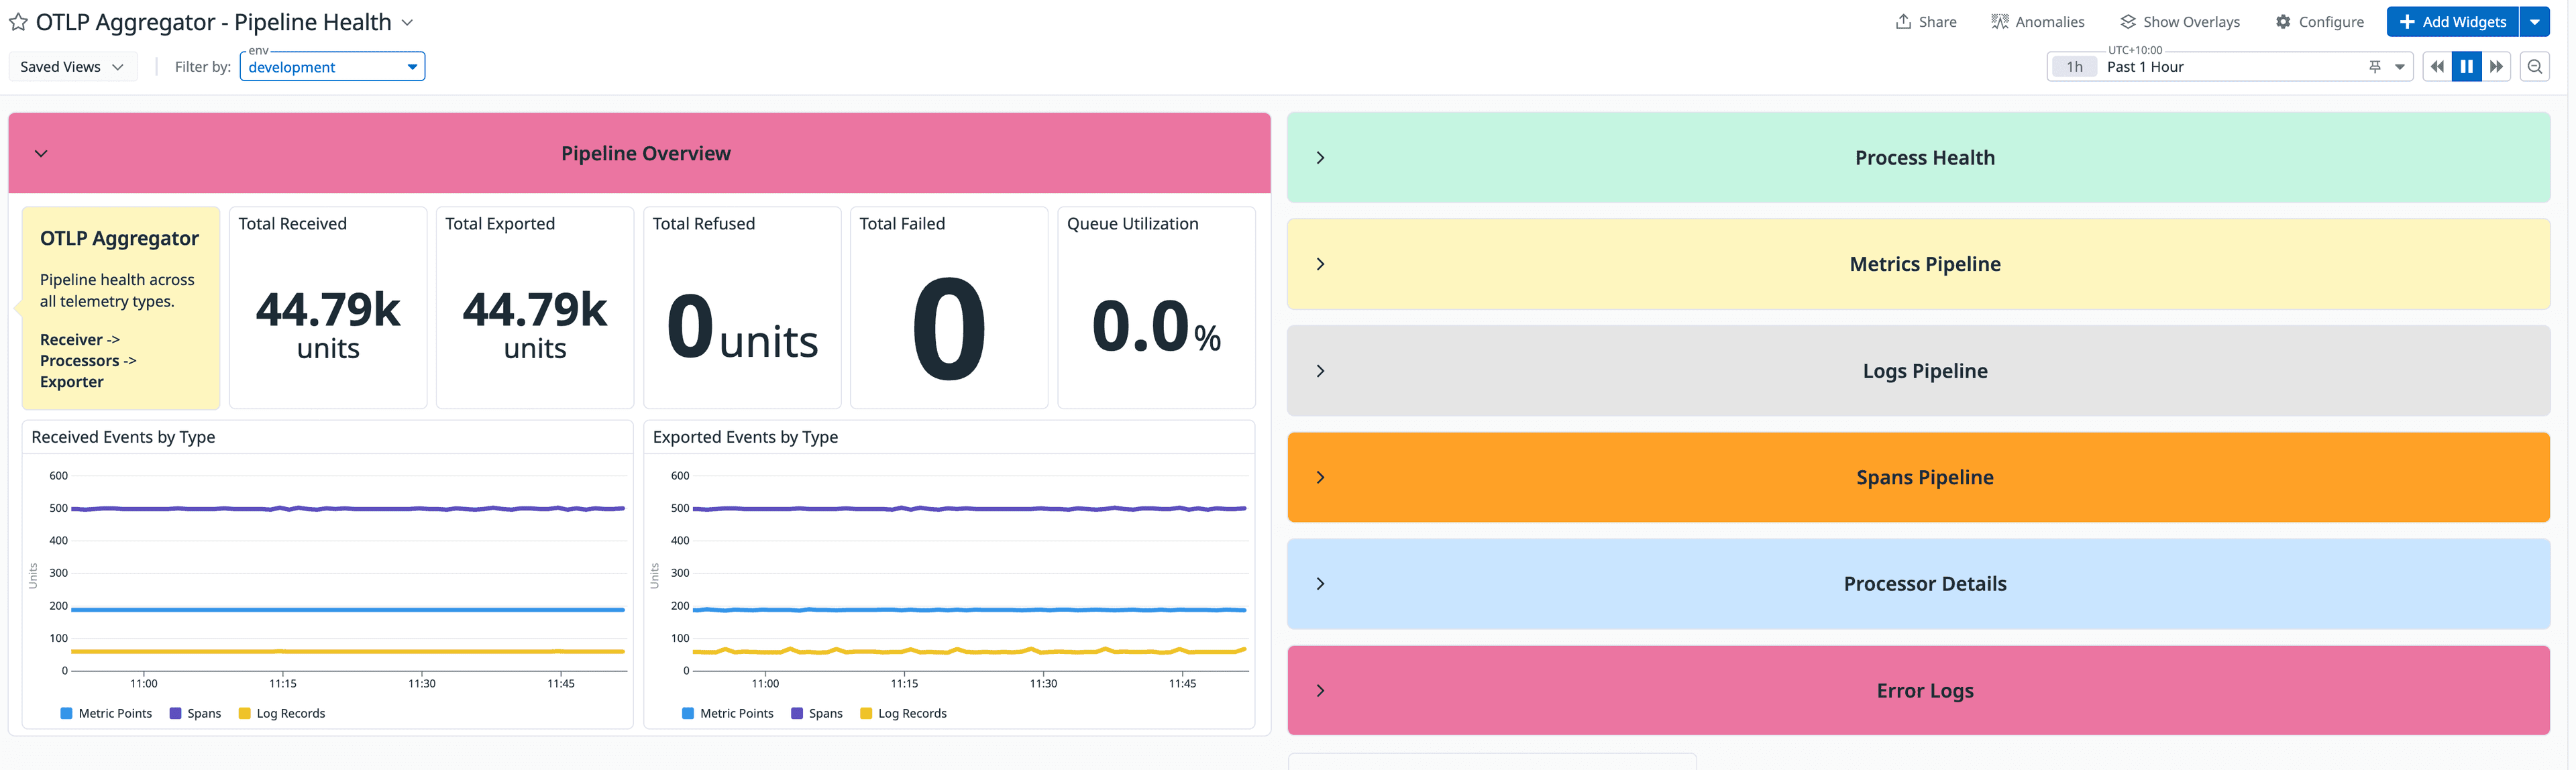
1. Observability: Your Dashboard Is Lying to You
Your overall pipeline error rate sits at a comfortable 1.3%. Looks healthy, right? Hidden deep inside that blended average, one isolated processing stage is silently dropping 40% of events coming from a single critical source.
You must tag every single metric by both stage and source, never blend them. If you cannot answer "which stage is degraded right now?" from a single dashboard view, your observability is doing you a disservice.
Beyond standard golden signals, pipelines require two unique telemetry metrics:
A. Consumer Lag: Your Actual Heartbeat
Queue Depth:  [■■■■■■■■■■■■■■■■■■■■] ◄── Producers writing here
                             ▲
Consumer State: [■■■■■■■■■■■■]       ◄── Workers processed up to here
                             └─── Lag = This Gap
Flat Lag: Your consumers are keeping pace with production.
Growing Lag: Your consumers are falling behind. If lag hits your upstream retention window, you will begin losing data permanently with no errors, no alerts, just complete absence. This is the metric that should wake you up at 3:00 AM, not CPU.
B. Data Completeness Rate
A pipeline can have zero processing errors and still be missing entire source streams because an upstream agent crashed or a network path went dark. Error rates will never catch this because there are no errors to count, just silence.
You must track expected events per source per time window against actual received events. When a source goes quiet, you want an immediate alert, not a post-mortem ticket on Tuesday morning.
The Three Pipeline Dashboard Layers
| Layer | Focus | Metrics Included | Target Audience / Use Case |
|---|---|---|---|
| 1. Pipeline Health | Blended signals | Overall throughput, global error rates | Initial Triage |
| 2. Stage Deep-Dive | Per-stage & per-source | Processing latency, per-source completeness | Deep Diagnosis |
| 3. Data SLI | End-to-end metrics | End-to-end latency, completeness rate | Customer Impact |
2. Negotiate SLAs Before Writing Alert Thresholds
Your completeness targets mean nothing without explicit agreements with the engineering teams whose data you are carrying. Crucially, these agreements are not uniform, and they should not.
For each upstream source, explicitly negotiate three parameters:
1. Latency SLA ----------- How fresh does data need to be at the sink? (Sets pipeline SLO)
2. Availability --------- Expected uptime of this source? (Drives completeness thresholds)
3. Acceptable Staleness -- How old is too old? (Drives cache TTL & fallback strategy)
The Operational Trade-off
When a source degrades, you must choose your failure mode before the incident forces it on you:
Serve Partial (Completeness takes the hit): Return what arrived and skip the degraded source. You maintain current data, but it is incomplete.
Serve Stale (Freshness takes the hit): Fall back to the last-known-good state from a cache. Your data remains complete, but old.
3. Ingestion: Machines Have No Manners
Human traffic has natural, smooth curves. Machine traffic is completely feral.
Every single service instance in your fleet will flush its 60-second metric batch at the exact same second. Your ingestion layer will routinely experience traffic spikes that look identical to a distributed denial-of-service (DDoS) attack. This isn't an anomaly; it's just Tuesday.
Build your ingestion layers for the peak spike, not the rolling average.
The Ingestion Trade-off Matrix
| Data Type | Drop Under Pressure? | Verdict |
|---|---|---|
| Metrics & Traces | Yes | A sampled representation is still highly useful. Lossy ingestion is fine. |
| Application Logs | Depends | Align explicitly with your team's retention policies. Document the choice. |
| Audit & Billing Events | No | Missing events represent a data integrity incident. Must be lossless. |
4. Buffering: The Shock Absorber You Cannot Skip
Placing an explicit storage buffer between your ingestion endpoints and your processing workers decouples your architecture completely:
Without Buffer:  Producer ──► [ Processing ] ──► Sink (If Sink drops, producers block or data dies)
With Buffer:     Producer ──► [ Durable Queue ] ──► [ Processing ] ──► Sink (Queue absorbs load if Sink drops)
Whether you choose Kafka, Pulsar, Kinesis, or GCP Pub/Sub matters less than the intentionality of the decoupling.
Three Rules to Save Your Production State
Dead Letter Queues (DLQs) are non-negotiable: Malformed, poisoned, or repeatedly failing events must be shunted to an inspectable, replayable storage bucket. You will need to replay from a DLQ eventually build the tooling before you need it.
Set retention based on recovery windows: How long can your downstream sinks sit completely offline before you experience irreversible data loss? That operational timeframe sets your queue retention config rather an arbitrary default.
Batch writes on hot paths: Writing synchronously to a queue per event at high volume will destroy throughput. Batch events aggressively. The trade-off is a tiny data-loss window if a process crashes.
Handling Queue Pile-Ups
When a queue grows past its threshold, your system must execute a explicit, deterministic strategy:
Option A: Shed Load (Drop Tail). Purge the oldest or lowest-priority events at a specific threshold. This protects pipeline stability at the cost of deliberate data loss.
Option B: Backpressure. Signal upstream producers to slow down. This guarantees no data loss, but propagates execution pressure directly back to your live application services.
Option C: Scale Out Consumers. Burn down the queue backlog by dynamically adding processing capacity. This avoids data loss and upstream impact, but only works if the bottleneck is compute-bound, not a rate-limited or struggling downstream sink.
5. Advanced Reliability: The Small Things That Bite Hard
Graceful Draining: When a pipeline stage restarts, it must process all in-flight messages before exiting. A hard kill mid-batch forces re-processing on restart, which is fine if your downstream sinks are completely idempotent, but an absolute mess if they aren't. Always implement and test shutdown hooks.
Idempotent Sink Writes: Your sinks will receive duplicate events under normal at-least-once streaming delivery. Implement upserts, deduplication keys, or content-addressed storage long before your first production replay.
Clock Skew Across Environments: Collecting logs on GCP and processing them on AWS ECS? Independent NTP configurations can introduce subtle clock skews. A 200ms misalignment is invisible in standard contexts but quietly corrupts time-windowed aggregations. Normalize all timestamps to UTC at the point of emission, never at the sink.
6. Scaling on the Correct Signal
If your pipeline is falling behind, your consumer lag is growing, but your CPU usage sits at an idle 22%, a standard autoscaler will do nothing. Your data will hit its retention limit and vanish. The bottleneck is almost always a slow sink write, making your pipeline heavily I/O-bound.
Use platforms like Vector to scale workloads natively based on consumer lag metrics. On AWS ECS, publish queue lag as a custom CloudWatch metric to drive your scaling alarms. Scale your infrastructure before lag becomes a data loss risk, not after.
7. Security: Two Things That Always Get Skipped
Authenticate your producers: An unauthenticated ingestion endpoint accepting arbitrary JSON payloads is a severe event injection vector and an exfiltration surface. Enforce mTLS or token-based authentication even for internal agents.
Scrub PII as early as possible: Every architectural hop that unmasked Personally Identifiable Information (PII) travels through, your queue, your state store, your replay buckets, quietly expands your compliance audit scope. Build tokenization and regex redaction patterns directly into your ingestion gateway, never as a cleanup step at the end.
Summary
You are not building a simple service that shuffles data from point A to point B. You are building a fault isolation layer that happens to be shaped like a pipeline.
When designed correctly, your data consumers will always know exactly what they received, how complete it was, how fresh it was, and how to replay it if an outage occurs. That transparency is your architectural contract, everything else is just the infrastructure built to protect it.